Ben Keller · 7 September 2026
Custom Dashboard Configurations for Tracking Traffic Shifts in Analytics Platforms
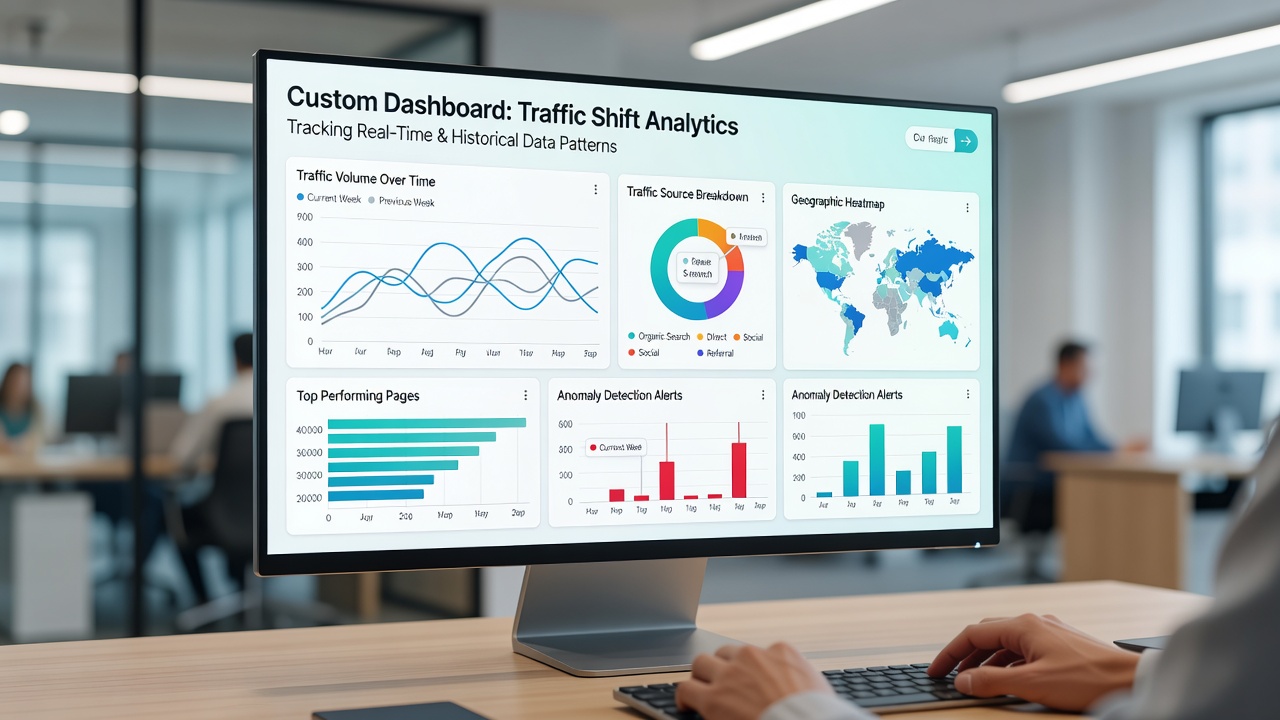
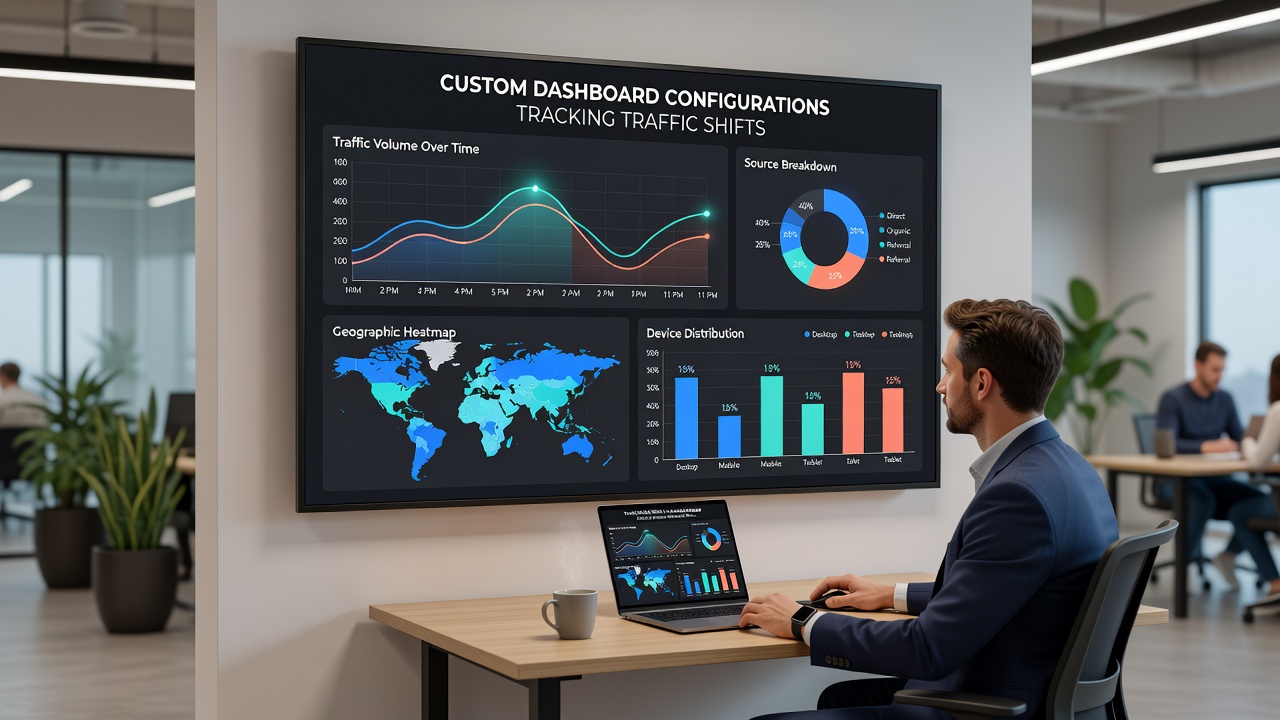
Analytics platforms allow users to build custom dashboards that monitor traffic shifts across organic, direct, referral, and paid channels, and these configurations rely on specific metrics, segments, and visualization tools that update in real time.
Platform documentation shows that custom setups begin wth selection of core dimensions such as source, medium, landing page, and device category, while users combine these with calculated fields that flag percentage changes over rolling seven-day or thirty-day windows. Research indicates that teams often define alerts when traffic from a single source drops beyond a preset threshold, and the same configurations support comparison against historical baselines pulled from the prior year.
Defining Metrics and Segments for Shift Detection
Effective dashboards require metrics that capture both volume and velocity, so practitioners create custom events that record entry points alongside session duration and bounce rates, and they layer segments that isolate new versus returning visitors. Data shows these segments reveal whether a traffic decline stems from reduced acquisition or from changes in user behavior after arrival, and observers note that combining them with geographic filters helps isolate regional patterns without manual filtering each time.
Platforms released enhanced API endpoints in September 2026 that permit direct import of external campaign data into these dashboards, and the update allows automatic alignment of paid and organic performance in a single view. Those who studied the release documentation found that the new endpoints reduce manual CSV uploads and support scheduled refreshes every hour during high-traffic periods.
Visualization Choices That Highlight Patterns
Line charts with dual axes display absolute traffic alongside percentage deviation, and area charts stacked by channel make sudden reallocations visible at a glance. Heat maps that plot hour-of-day against day-of-week expose recurring dips that might otherwise blend into weekly aggregates, while tables sorted by change magnitude surface the pages or campaigns driving the largest movements. Experts have observed that color-coding positive and negative shifts improves quick scanning during daily reviews, and the same color rules carry over when dashboards are shared with stakeholders who lack deep platform experience.
Integration With External Data Sources
Custom configurations frequently pull in weather, economic indicators, or competitor launch calendars to contextualize spikes or drops, and platform users connect these feeds through scheduled imports or direct API calls. According to figures from Eurostat, digital traffic volumes across EU member states showed measurable correlation with holiday retail calendars in recent quarters, and similar external overlays appear in North American dashboards that track Black Friday preparation periods. The integration keeps the primary analytics view focused on site performance while the contextual layers remain toggleable.
Alert and Automation Workflows
Once metrics and visuals are in place, teams attach threshold-based notifications that trigger email or messaging alerts when predefined conditions occur, and these workflows extend to automatic report generation that lands in shared folders at the start of each business day. Platforms support conditional formatting that highlights cells exceeding two standard deviations from the mean, and users test these rules on historical data sets to confirm they catch meaningful events rather than normal fluctuations. Research from university studies on web measurement practices indicates that organizations running such automated checks reduce response time to traffic anomalies by measurable margins compared with manual monitoring alone.
Additional filters for bot traffic and internal employee visits prevent inflated baselines from skewing shift calculations, and the same filters apply retroactively when users adjust historical comparisons. Those configurations often include a separate tab that isolates suspected invalid traffic so analysts can review and exclude it without altering the primary data set.
Conclusion
Custom dashboard configurations combine precise metric selection, layered segments, clear visualizations, and external context to surface traffic shifts as they develop, and the September 2026 platform enhancements further streamlined data imports that support these setups. Organizations that maintain these configurations gain consistent visibility into channel performance and can respond to changes with documented processes rather than ad-hoc checks.